Voting intention: 12th Feb 2025

Our new Voting Intention tracker shows Reform UK in first place with only small changes from last week
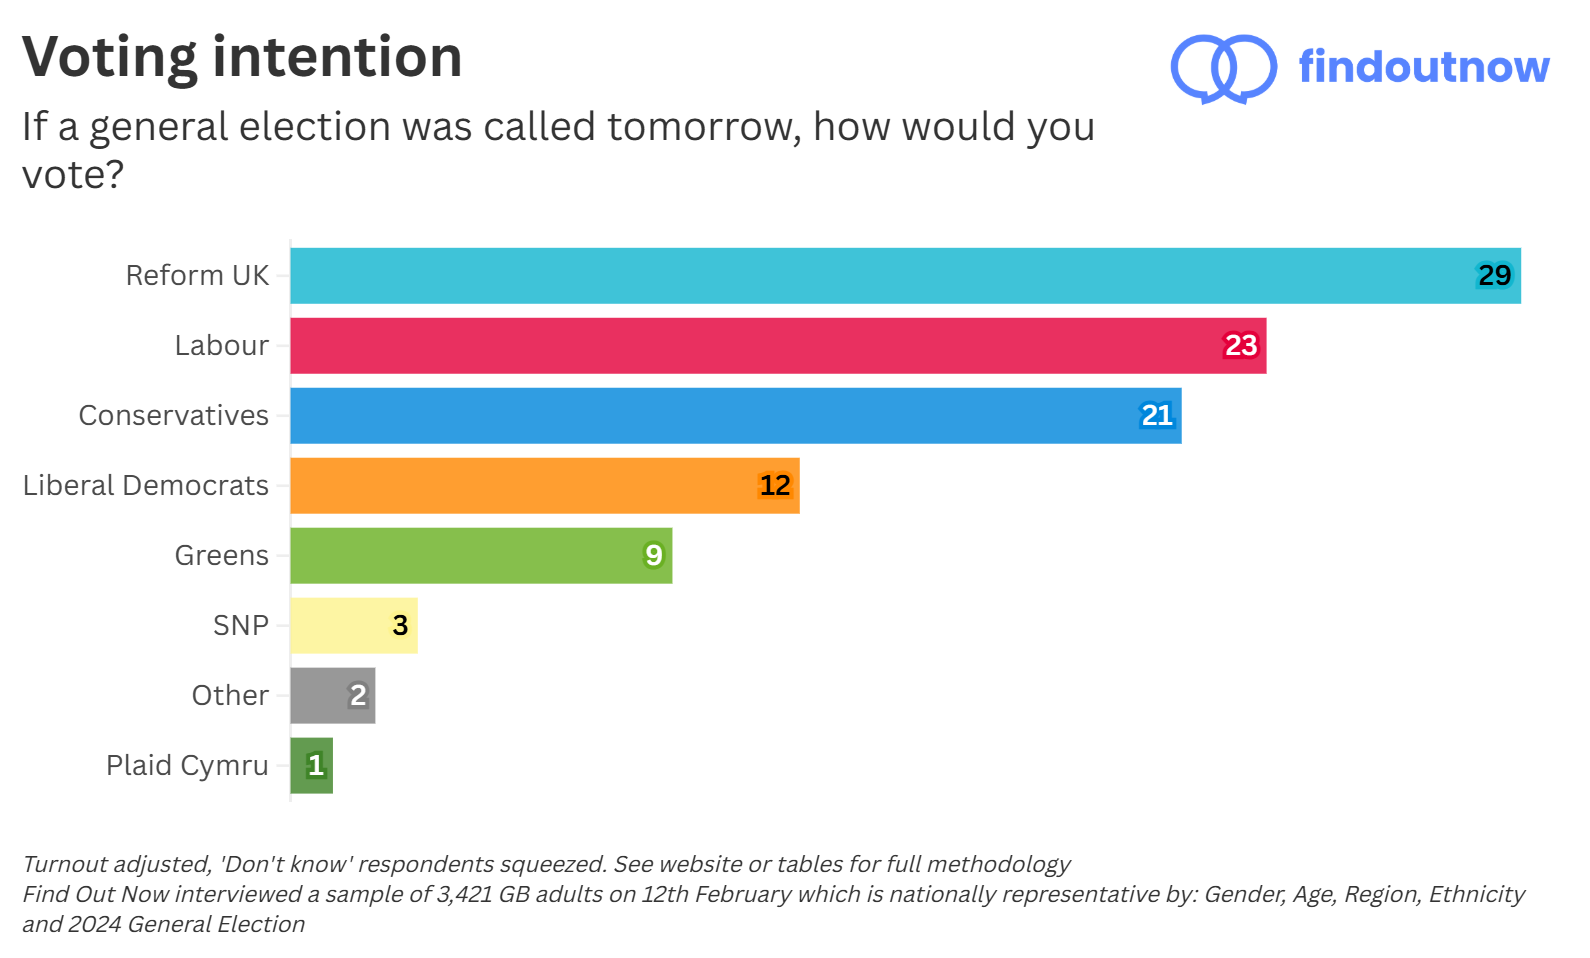
Turnout adjusted, ‘Don’t know’ respondents squeezed. Full methodology listed below or in the data tables. Find Out Now interviewed a sample of 3,421 GB adults on 12th February which is nationally representative by: Gender, Age, Region, Ethnicity and 2024 General Election
How have the results changed over time?
Due to the margin of error (the statistical range within which the true result is likely to fall, usually 2-3% for polls), small week-on-week changes in results may be caused more by random sampling variation, rather than reflect genuine shifts in public opinion. This seems likely to be the case for the current shifts in support for the Conservatives and Labour, where their levels of support are identical to those from 2 weeks ago.
The main trend has been the growth of Reform UK (from 22% to 29%) – driven by them by retaining almost all of their 2024 GE support (retaining far more than any other party), winning over a quarter of 2024 GE Conservative voters, and winning half (50%) of people who didn’t vote in 2024 but say they would “definitely vote” this time. They have not dropped in support over any of our voting intention polls since November, with their rise seemingly mainly at the expense of the Conservatives.
Notably, Labour support has remained steady – fluctuating around 25% with no significant changes since November.
| 27th Nov | 4th Dec | 11th Dec | 8th Jan | 15th Jan | 22nd Jan | 29th Jan | 5th Feb | 12th Feb | (change since first poll) | |
| Conservative | 27 | 26 | 23 | 20 | 25 | 23 | 21 | 18 | 21 | -6 |
| Labour | 25 | 23 | 26 | 25 | 24 | 22 | 23 | 25 | 23 | -2 |
| Reform UK | 22 | 24 | 25 | 25 | 25 | 26 | 27 | 29 | 29 | +7 |
| Liberal Democrats | 12 | 11 | 11 | 11 | 12 | 12 | 11 | 13 | 12 | – |
| Green Party | 9 | 9 | 9 | 11 | 10 | 10 | 10 | 10 | 9 | – |
How does Find Out Now differ from other polling companies?
Unlike some polling companies, we explicitly ask about people’s likelihood to vote – before asking them which party they plan to vote for – which factors into our final headline VI calculation. In our experience, running a voting intention as a single question with a ‘would not vote’ option encourages respondents to select a party even if they are unlikely to vote, which inflates declared turnout. Given Labour voters (in particular) are less likely than others to say they’re planning to vote, not accounting for this understates the impact of turnout differentials in the headline calculations.
In addition, when respondents say they ‘Don’t know’ how they plan to vote (even after prompting) we exclude them from the final headline VI calculation. This approach differs from some other companies. Some pollsters impute the voting intention of these respondents based on other respondents in the same poll with similar demographics and previous voting behaviour. Others explicitly reallocate these respondents based on how they previously voted – i.e. a 2024 Labour voter who now says they ‘don’t know’ how they would vote, is counted towards the Labour total.
While those approaches allow for a more stable voting intention series over time, our approach makes our voting intentions more sensitive to the current stated voting behaviour of respondents. Both approaches are valid – but helps explains why our final headline vote shares may be different to other pollsters.
Our methodology:
- We ask respondents how likely they would vote if there were a general election tomorrow. To those who said ‘definitely’ or ‘very likely’ we then ask their vote choice
- If a respondent answers ‘Don’t know’ they see an additional question, prompting them again to give an answer. If they then give a valid vote choice they are included in the final calculation, but if they answer ‘Don’t know’ again they are excluded from the final headline calculation
- If a respondent was eligible but didn’t vote at the last general election, they are only included in the final headline calculation if they say they are ‘definitely’ going to vote this time. This is because past voting behaviour is generally more predictive than their declared intentions
- The final sample is filtered and weighted (more details here) to be nationally representative by Gender, Age, Region, Ethnicity and 2024 General Election vote
- A deeper discussion of our methodology in the context of the 2024 General Election can be found here
Full data tables can be found here
This poll was initiated solely by Find Out Now and not funded by any third party