Small Lead for Yes to Scottish Independence

Find Out Now have conducted a hypothetical Scottish Independence Referendum voting intention poll for Independent Voices finding that 49.4% would vote Yes, 46.2% No, and 4.5% Don’t know. Like our last Independence Referendum poll, we used more up to date population quota estimates from the ONS, taken from the 2021 census, as well as including quotas for the 2014 Independence Referendum, taking ageing into account.
With 2014 vote quotas:
- Yes – 49.4%
- No – 46.2%
- Don’t know – 4.5%
Without 2014 vote quotas:
- Yes – 49.5%
- No – 45.1%
- Don’t know – 5.4%
The survey asked 3,532 Scottish adults how they would vote, and how likely they would be to vote, before outputting a representative sample size of 1,187 based on ONS’s 2021 population estimates for age, gender, Scottish region, social economic group, EU 2016 vote, GE 2019 vote, Indyref 2014 vote (where stated above), and turnout likelihood. The past vote quotas were also adjusted for an ageing population, namely increasing the “could not vote” quotas, and decreasing the other quotas accordingly.
Tables
Turnout adjusted voting intention results with 2014 IndyRef quotas
Turnout adjusted voting intention results without 2014 IndyRef quotas
Turnout adjusted turnout likelihood results with 2014 IndyRef quotas
Turnout adjusted turnout likelihood results without 2014 IndyRef quotas
Non-turnout adjusted voting intention results with 2014 IndyRef quotas
Non-turnout adjusted voting intention results without 2014 IndyRef quotas
Non-turnout adjusted turnout likelihood results with 2014 IndyRef quotas
Non-turnout adjusted turnout likelihood results without 2014 IndyRef quotas
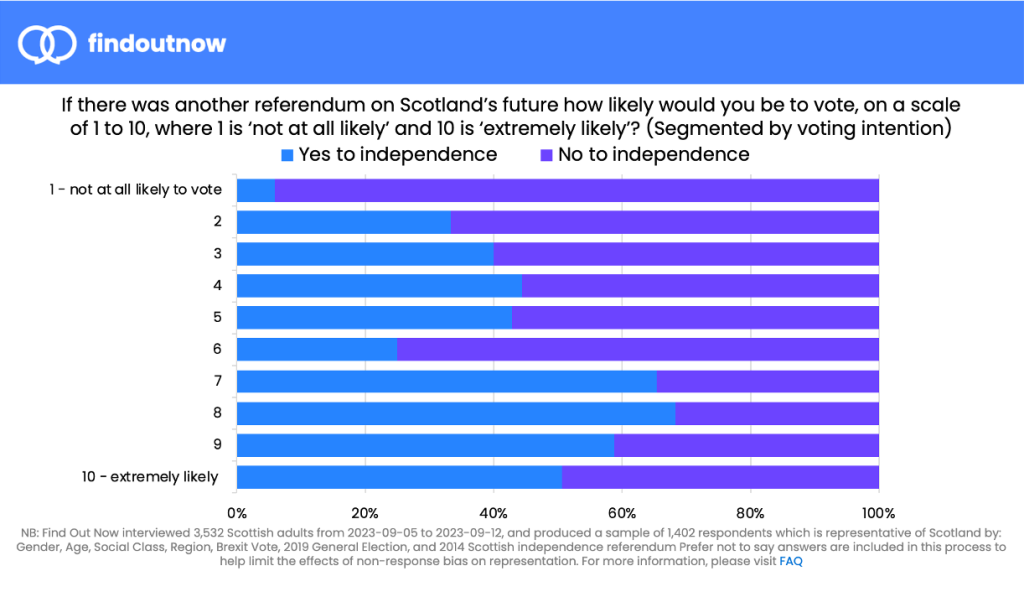
Turnout likelihood tipping the balance
The voting intention results before turnout likelihood is adjusted for is reversed, a marginal lead for No. Our voting likelihood adjustment sets the threshold for counting a response as a vote or not so that the overall turnout would be 85%, as it was in the actual Independence Referendum in 2014. in this case, the threshold is set at 6, so anyone who says they are “6” to “10 – Extremely likely” to vote are included.
Yes respondents answer that they are more likely to vote on average than No voters (9.6/10 Vs. 8.8/10), so more of their voting intention answers are included in the turnout adjusted results.
It is unclear whether this would accurately reflect the respondents’ behaviour in a real world referendum. When faced with a real-world outcome they do not like, they may become more motivated to act.
In addition, our (and others’) hypothetical voting intention polling does not, and cannot, take into account the campaigning that would precede a real-world referendum or election. No could perform better than expected, and tip the balance back, but the reverse could also be true.