How pollsters may be understating the Reform vote

We hosted a webinar based on this article, which can be viewed on YouTube
Summary
- Find Out Now has been a consistent outlier on Reform voting intentions, giving them a higher share of the vote than other pollsters
- However, our recent performance (being most accurate in mayoral elections) suggests that this is not an error
- We believe there are three things causing pollsters to understate Reform:
- Too many highly-engaged respondents
- Overstating turnout
- False recall of 2024 GE vote
- Reform voting correlates with low political attention. Given most online panels (but not Find Out Now) over-index on highly-engaged respondents, they understate the Reform vote share
- Most pollsters over-estimate turnout. Given Reform voters are more likely to vote, this flattens the difference between them and other parties, thus understating their voteshare
- Many Con to Reform switchers experience “false recall” and misremember voting Reform in 2024. Pollsters who reask 2024 GE each survey thus understate the extent of Con to Reform switching, and thus the Reform voteshare
- The combined impact of these three interventions likely explains the majority of the difference between Find Out Now and other pollsters on Reform voteshare
Our record so far
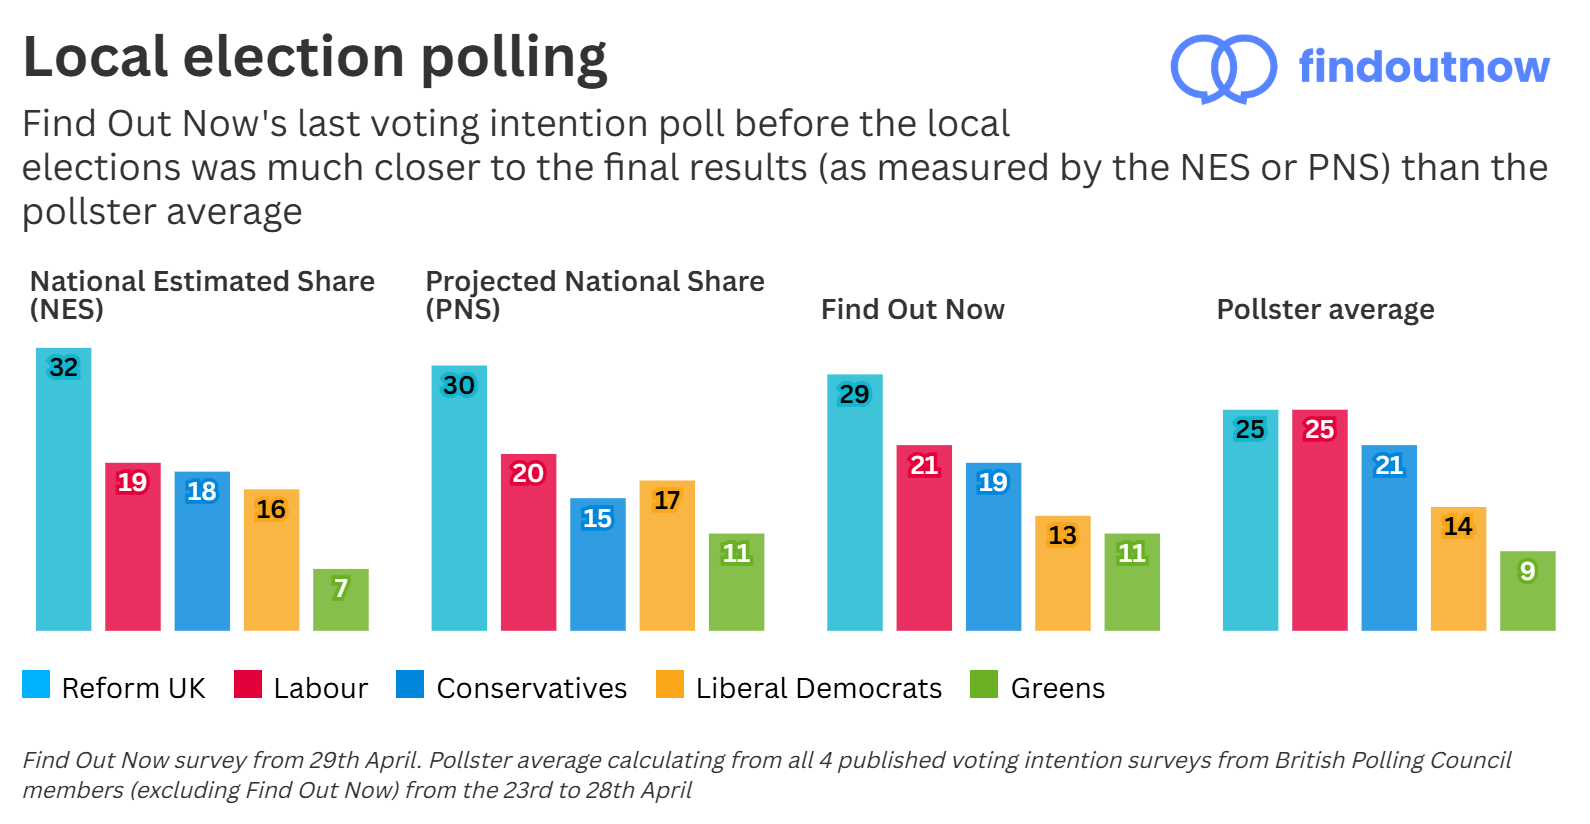
Find Out Now has been a consistent outlier on Reform voting intentions. In the run-up to the local elections in May, Find Out Now forecast Reform having 29 per cent of the vote, 4 points higher than the average of pollsters excluding us. As such, we gave Reform an 8 point lead over Labour – a much more accurate prediction of the local election results (see below) compared to a less than 1 point lead from the pollster average. Although these figures have reduced since the local elections, a difference is still evident, the equivalent figures for June being Find Out Now predicting Reform 1 point higher and the Reform lead over Labour 3 points higher than the pollster average excluding us.
Our recent performance suggests that these results are likely correct. We were the most accurate pollster in the mayoral elections:
| Average error per candidate | |
| Find Out Now | 2.1 |
| YouGov | 2.3 |
| More in Common | 3.3 |
(Note: More in Common were the only pollster to correctly call the winner of the West of England mayoral election. So if just betting on the winner, they’d arguably have been the best guide. However, as a guide to determining accuracy of past and future performance, the underlying polling numbers are most important, which Find Out Now performed best on)
In addition, the Find Out Now headline voting intentions were the closest of any pollster to the overall local election results. Given only certain parts of the country participate in the local elections each year, there exist several measures to “translate” the local election results to overall vote shares for if the entire country had been able to vote. This is not a perfect proxy, given voters don’t necessarily behave the same way in a local versus a general election (e.g. Liberal Democrats usually overperforming). However, it is perhaps instructive that Find Out Now’s Wednesday 29th April poll (fieldwork taking place day before local elections) was the only voting intention of any pollster to be comparable to either the Projected National Share or National Estimated Share.
Finally, we also correctly forecast the Runcorn and Helsby by-election. Our poll of the constituency in March forecast a narrow lead of Reform over Labour, which eventually transpired. We place less emphasis on this poll, given it was conducted over a month prior to the by-election, and the very small sample size meant it had a high margin of error. But the fact that despite those errors it came close to the eventual result, is suggestive of the underlying strength of our wider polling.
Regarding the 2024 General Election, a full write-up of our post-election report can be found here. Although we didn’t publish a contemporaneous public voting intention series, the results from a voting intention survey we ran on July 3rd (the day before the election) suggested we would have been the third-most accurate out of 18 pollsters. In addition, since the election we have made two significant changes to our methodology, namely:
- Directly sampling and weighting on ethnicity
- Excluding respondents who did not vote at the last election from our headline voting intention figures, unless they say they would “definitely” vote this time
Retrospectively applying those changes would have led our final results to have been more accurate than the most accurate pollster at the last election. We can claim no credit for this, given we didn’t publish results at the time, and are making changes with the benefit of hindsight. However, it does give us renewed confidence in our polling methodology going forward.
Too many highly-engaged respondents
Over-engagement and “career responders” have been a perennial issue for polling (one example of many here). In effect, respondents who sign up to take part in surveys – and particularly online surveys – are much more politically engaged than the average person. On the contrary, those who are less politically engaged are less likely to take part in polls, and less likely to answer questions about politics.
This is a problem due to ‘Nonignorable nonresponse’, where the reasons for a respondent not doing a survey are related to the variable being measured. In this case, the same factors which cause a respondent to be more likely to vote Reform, are the same ones which cause them to be less likely to sign up for a polling panel. Without addressing this, polls are likely to understate the extent of Reform party support.
This is normally not a big issue, given most low-engaged people naturally don’t engage with voting (so the problems cancel out). However, Reform voting – with parallels to Brexit – correlates with low political engagement. As British pollster James Johnson has said on American polling “They [pollsters] understated the Trump voter who is less likely to be engaged politically, and crucially, more likely to be busy, not spending 20 minutes talking to pollsters”.
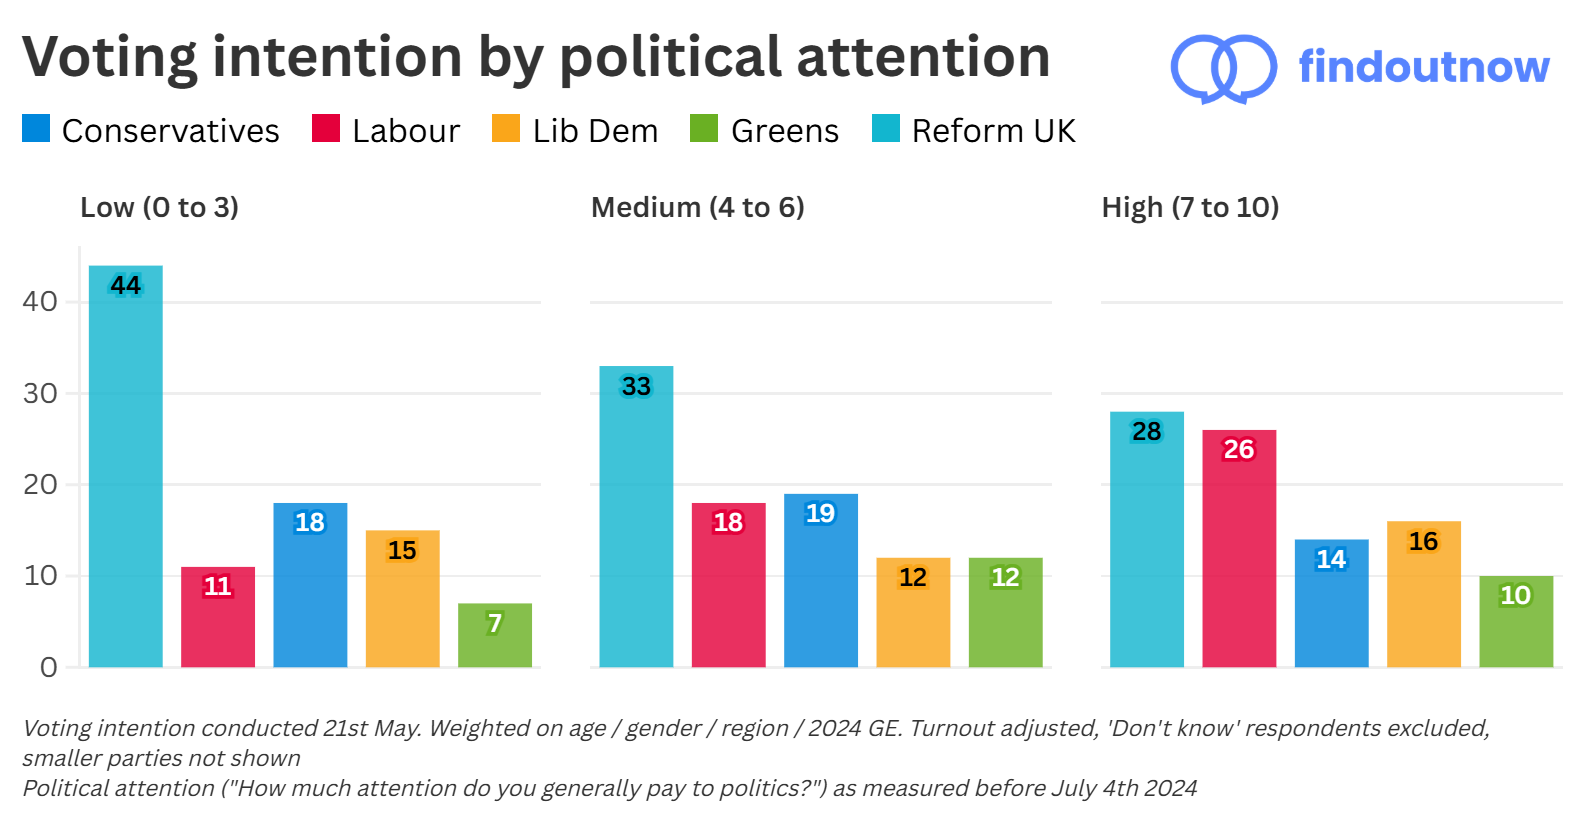
Our research finds 44% of those with low political attention (as measured prior to the General Election) would now vote Reform. So in principle, given most polls under-index on respondents with low political attention, they will understate the overall extent of Reform support:
By contrast, Find Out Now is able to capture these respondents in a way that other polling companies struggle to do. Find Out Now has significantly lower numbers of high-engagement respondents than other panels. As the below table shows, ~40% of Find Out Now respondents belong to the ‘low political attention’ group, compared to only ~25% from the various iterations of the British Election Study (often seen as the “gold standard”, run with YouGov). Although we can’t authoritatively say what the “true” level of political attention is among the public, given over 40% of eligible voters did not vote at the last General Election, that seems most consistent with our numbers.
| Political attention | 2019 BES / YouGov (demographic weight) | 2019 BES / YouGov (past vote weight) | 2024 BES / YouGov (online) | Find Out Now July 2025 (demographic weight) | Find Out Now July 2025 (past vote weight) |
| Low attention (Don’t know + 0–3) | 23 % | 27 % | 24 % | 36 % | 41 % |
| Medium attention (4–6) | 34 % | 34 % | 30 % | 25 % | 23 % |
| High attention (7–10) | 43 % | 40 % | 46 % | 39 % | 35 % |
There are various reasons for this divergence between Find Out Now and other panels:
- Our respondents never explicitly signed up to answer surveys. Instead, responding to survey questions is a by-product of the user experience on our consumer site Pick My Postcode – being asked if they’d like to answer a few survey questions while they’re checking the site each day. So the resulting profile of respondents completing surveys differs from that of other panels
- Our respondents aren’t paid to complete surveys and they receive no disadvantage for not completing a survey. Counter-intuitively this leads to better quality data, as it removes any self-selection or bad incentives, such as people only doing surveys for money or trying to game the system
- Our surveys are much shorter than other panels. Most days, respondents see only a single survey question. For our ongoing weekly voting intention series, the average respondent completes it in only 16 seconds. This makes answering surveys much more accessible for low-engagement respondents, compared to standard industry practice of 10 or 15 minute surveys
Note: this may seem to be a shameless advert for Find Out Now (which we can’t fully deny!) However, while pollsters often shy away from discussions about what panels they use, it is impossible to fully judge survey quality without critically assessing the origin of sample data. Although US political polling now refers to this far more – see this discussion from British pollster James Johnson (who correctly forecast Trump’s victory in 2024) about the importance of mixed-mode polling – in the UK it is under-discussed.
Furthermore, we would note that although some pollsters may weight on political attention to counteract the problems discussed above, without directly addressing sampling this is unlikely to suffice:
Firstly, low-engagement respondents who do answer surveys are likely to differ materially – in views and voting intentions – from those low-engagement respondents who don’t. As Bailey (an academic expert on polling) cautions with an example from US polling “Weighting does not solve the problem. Many polls have disproportionately few white working-class voters. If among white working-class people, those who supported Trump were less likely to respond to surveys, weighting up the white working-class observations we do observe would do nothing but make us overconfident in incorrect results” (Bailey, Polling at a Crossroads, p. 103).
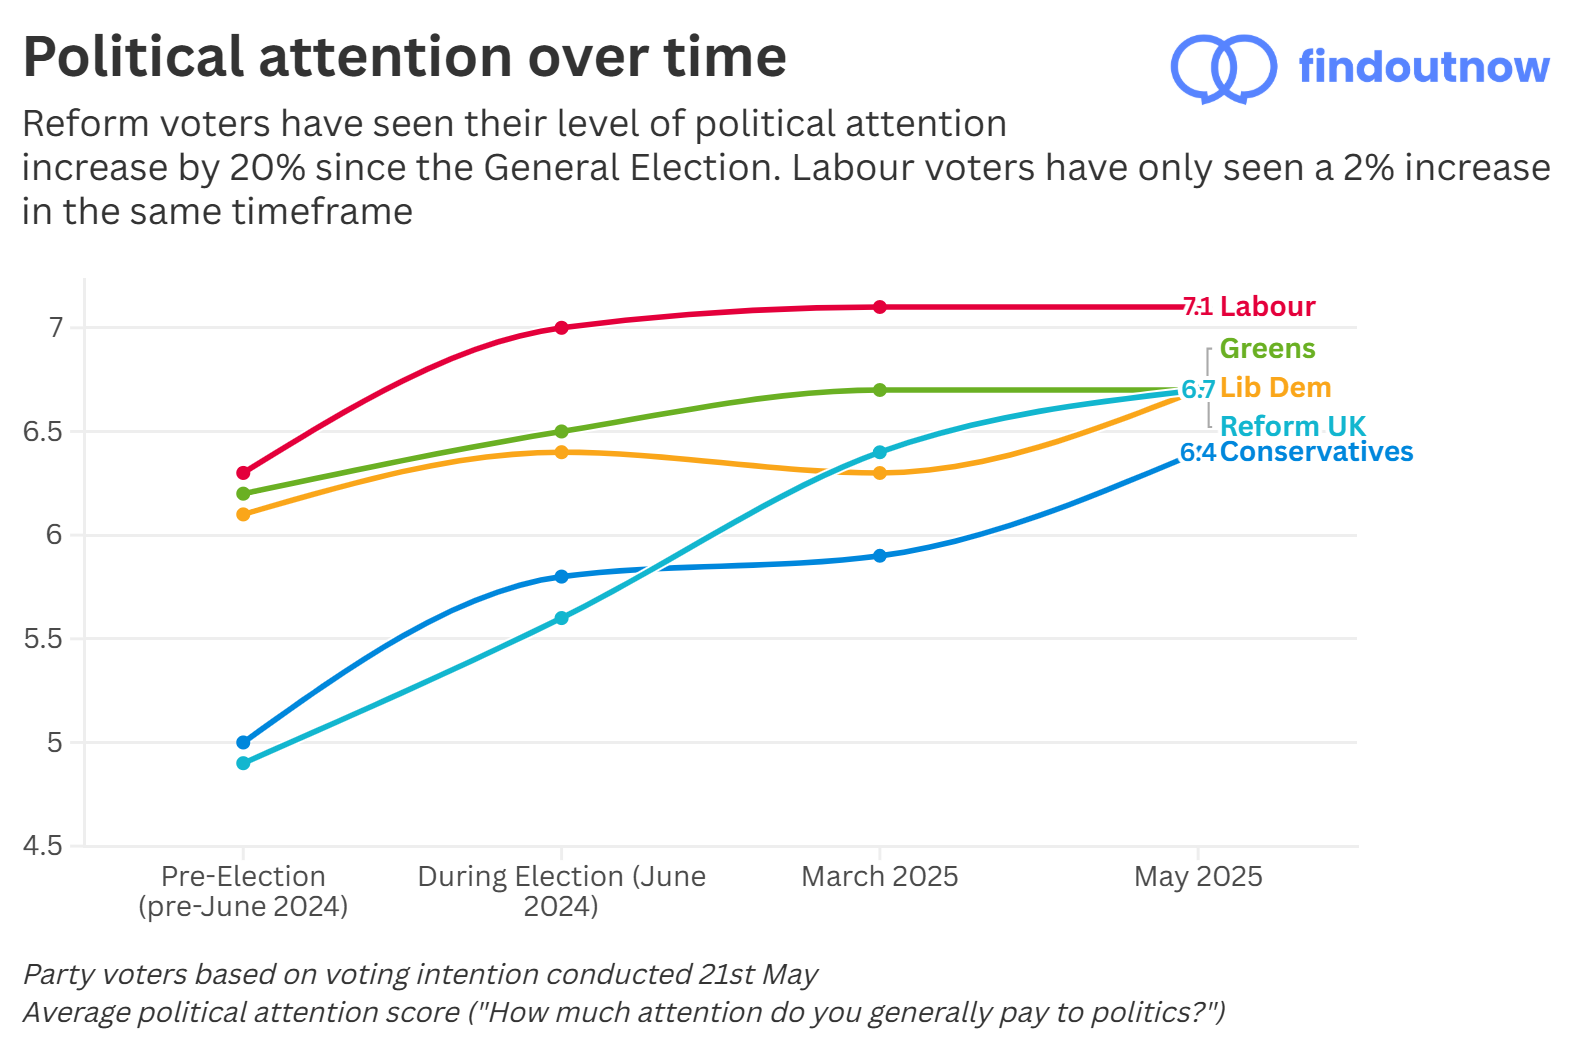
Secondly, although political attention is commonly used to identify “low engagement” respondents, given Reform’s mobilisation of previous non-voters – and corresponding increase in political attention, as the graph above shows – this may no longer work as an effective proxy. As although their political attention may now have increased, other attributes (like their survey participation) may not have.
Thirdly, any weights used for political attention would themselves be derived from another poll, being subject to the same engagement biases discussed above. In addition, these weights are derived from a single point of time, which cannot respond to changes in levels of political attention among the public. For example, weights derived from a survey conducted immediately after the 2024 General Election, would fail to capture the changes in levels of political attention as seen in the graph above.
Over-estimating turnout
There are various ways that pollsters seek to ensure their samples reflect those who will actually go out to vote. Most pollsters ask voting intention over several questions, with headline figures only calculated from those respondents who pass a pre-defined “likelihood to vote” threshold. Others have created turnout models, with respondents’ self-declared voting likelihood being less important than their demographic profile and previous voting history. Then there is also the question of ‘Don’t know’ respondents (those who say they will vote, but aren’t sure how they will vote) – whether they are excluded from the calculations, prompted again, or get otherwise reassigned.
These methodological decisions (combined with the nature of the raw sample used) have a significant impact on the final turnout calculations. Although there is no perfect way of doing this – different pollsters having had success with very different methods – this turnout calculation is important, as there is a clear link between correctly calculating turnout and correctly forecasting the election as a whole. For example, Verian were both the most accurate pollster for the 2024 General Election and the closest on turnout (their figure of 63% much lower than other pollsters, and close to the final figure of 60%).
This makes it even more striking that in the context of the rise of Reform UK a broad divergence has emerged – between those pollsters who forecast a high-turnout election with low Reform lead, and those who forecast a low-turnout election with high Reform lead.
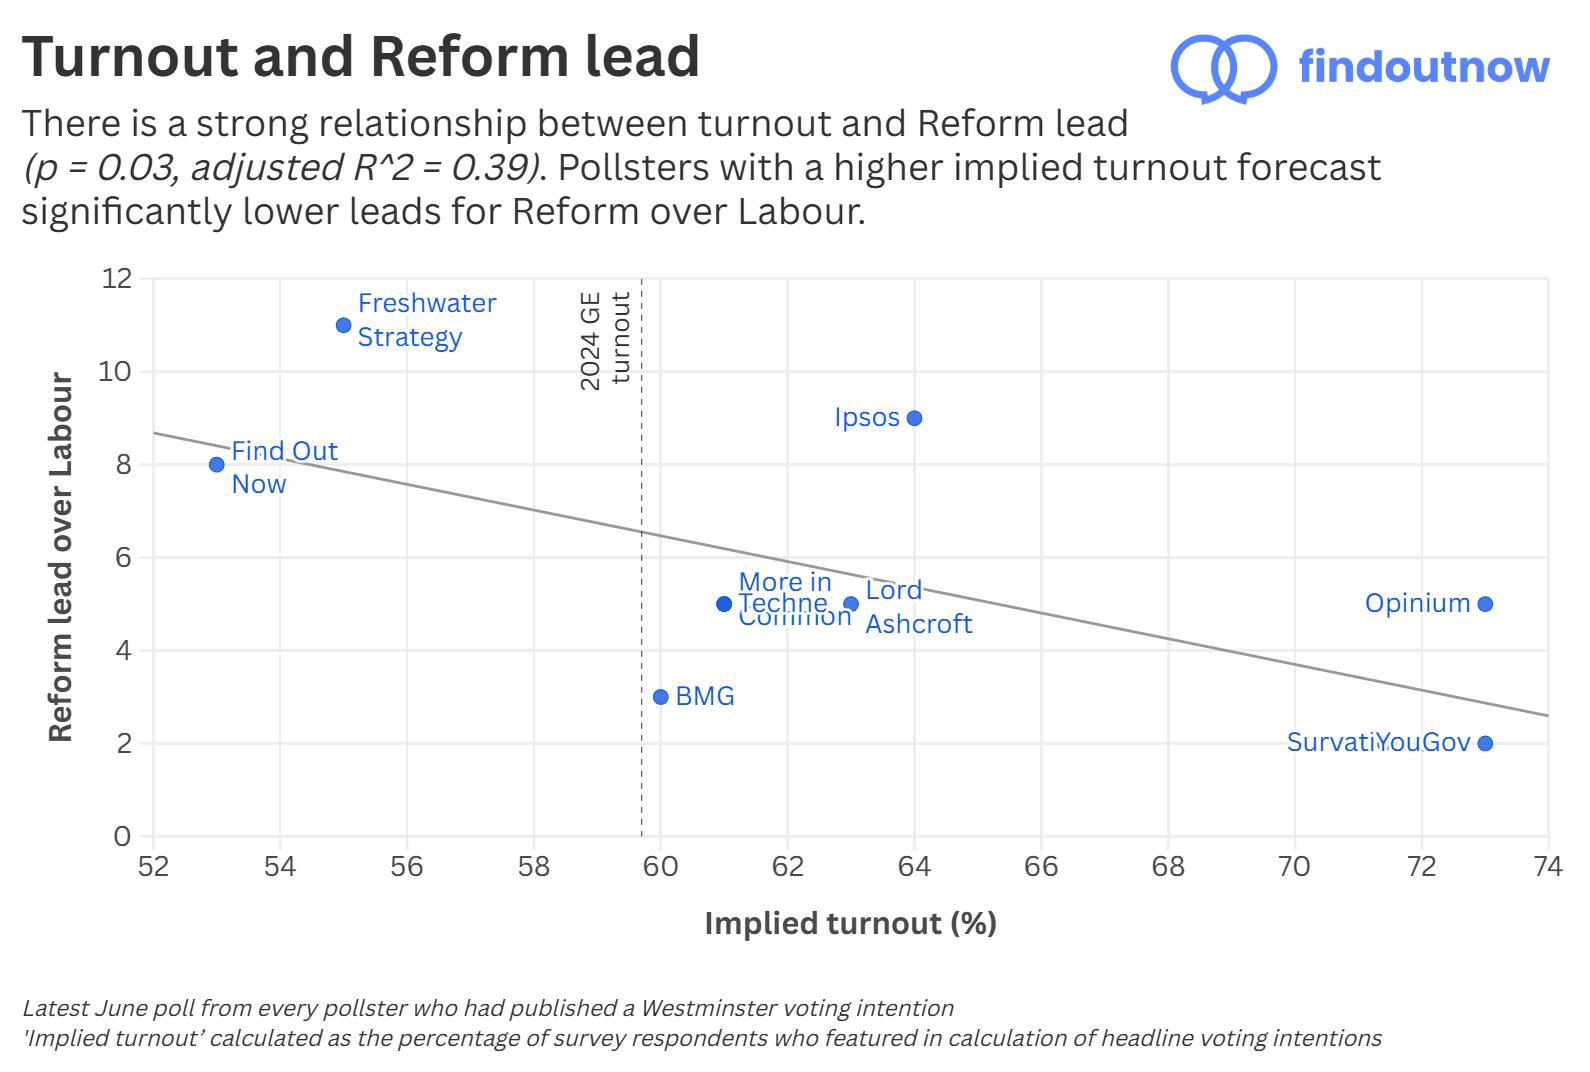
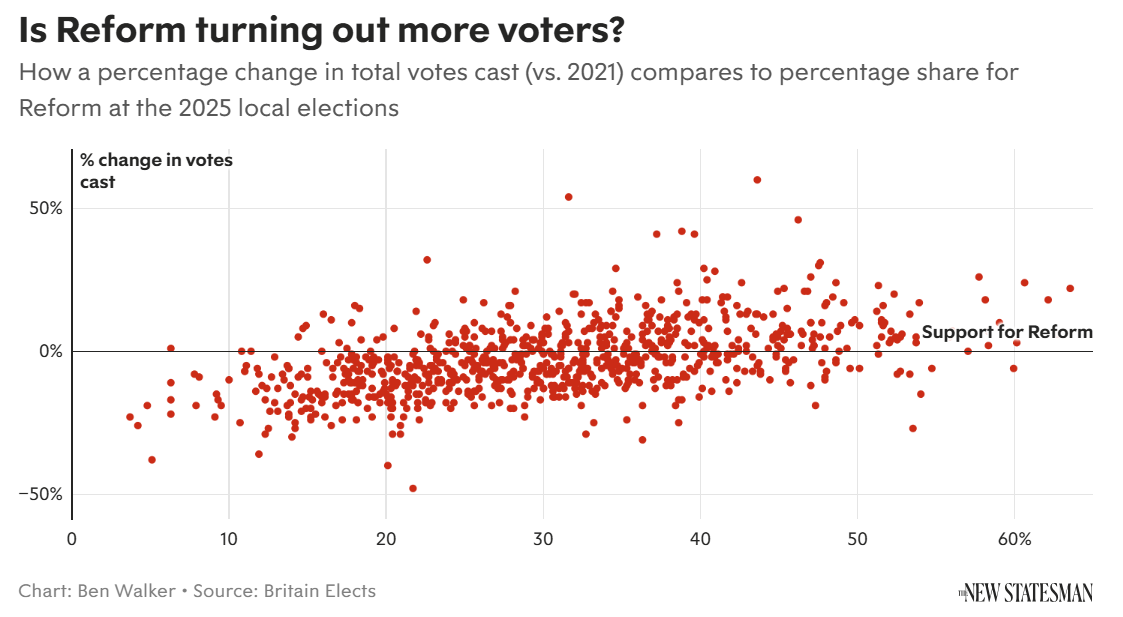
The graph above shows the latest June poll from each of the 10 pollsters who had published a Westminster voting intention. It shows the relationship between Reform’s lead over Labour (every poll showing a Reform lead) and the ‘implied turnout’, i.e. the percentage of survey respondents whose responses contributed to the calculation of headline voting intentions. What can be seen is a clear inverse relationship – statistically significant at the 5% level – between a pollsters’ implied turnout and the Reform lead over Labour.
This relationship is caused by the unique profile of Reform voters. From our polling, their voters are the most likely of any party to say that they will “definitely vote” at the next election. Inversely, Labour voters are significantly less likely to say that they will vote. As such, if assuming a high turnout election, this flattens the difference between Reform and voters of other parties (and particularly versus Labour) causing their vote share to be understated. By contrast, if assuming a lower turnout election, this greater turnout on behalf of Reform voters has a much greater impact on the final headline voting intention figures.
It is impossible to determine the “true” level of turnout years before an election. However, there are reasons to assume that this wider picture – of low overall turnout, higher turnout for Reform, and thus a large Reform lead – is most likely.
Firstly, this was borne out in the results from the May Local Elections. As Ben Walker from Britain Elects has highlighted, there is a clear correlation between Reform electoral performance and the areas where turnout has most increased – i.e. suggests that Reform voters have a higher turnout than supporters of other parties. One can debate to what extent this higher turnout would translate to a Westminster election, but it is worth noting that in our ongoing voting intention series, of 2024 non-voters who say they will “definitely vote” now, two thirds would vote Reform – suggesting that Reform are successfully mobilising previous non-voters.
Secondly, a forecast high overall turnout is inconsistent with observed turnouts in recent elections. The 2024 General Election had a turnout of 60%. By contrast, the highest implied turnout from the aforementioned June polls was 73% (with the same poll also showing a Reform lead of only 2 points). This seems implausible, given it would be a turnout greater than that of any General Election since 1992.
False recall
There are many ways in which pollsters can differ in how they calculate voting intentions. They can source their respondents from different places, phrase questions in different ways, use different weighting variables, or make different decisions on how to handle factors such as “Don’t know” respondents and how to factor (or not factor) for turnout. None of these decisions are necessarily wrong or right, but instead reflect different methodological decisions, and helps explain why pollsters can reach slightly different results in their polling. However, we have identified one problem in recent voting intention polling, which we think reflects not methodological decisions but systematic error – false recall.
False recall is where survey respondents misremember, forget, or deliberately misrepresent their past behavior or personal information. In the case of voting intentions, some people may have voted tactically at the election but now express what would have been their first choice party. Some may want to give the “right” answer (known as “social desirability bias”) even if not true for them. Others may be influenced by events since the election – such as switching their support to another party – which has influenced their memory of who they voted for. Or they might have just genuinely forgotten.
This is not a new phenomenon. A famous example of false recall would be support for the Iraq War. Despite polls at the time showing majority support for the invasion, subsequent recall polls from both the UK and the US (asking people how they thought in 2003) show a majority “remembering” having opposed it. Or in the context of British political polling, in 2019 YouGov reported that a significant number of people who voted for Jeremy Corbyn’s Labour Party in 2017 would no longer admit it to pollsters, thus risking their support being overstated if pollsters didn’t account for this.
Although this is a known phenomenon in polling – and something pollsters would likely be taking account of by 2029 – it is fair to say that one wouldn’t normally expect it to become relevant so soon after the last election. However, given the extent of volatility in British politics (from a clear Labour lead to Reform UK now preeminent) we think that it is already having an outsized impact on current voting intention polling. More specifically, this is affecting current Reform voters. 2024 GE Conservative voters who now say they’d vote Reform are the largest single component of the increase in Reform support. However, given the rapid growth in Reform support, we think that many Con to Reform switchers may be subject to false recall when reporting their 2024 GE vote.
To test this, we launched two new surveys, targeted to respondents who:
- Had voted Conservative in the 2024 General Election (based on data first collected in July 2024)
- Participated in any of our April or May voting intention surveys
- Said that they’d vote for either the Conservatives or Reform UK
This reasked the question “Who did you vote for in the July 2024 UK General Election?” which our respondents would previously have answered in a separate profiler question, asked shortly after the election. The results were striking.
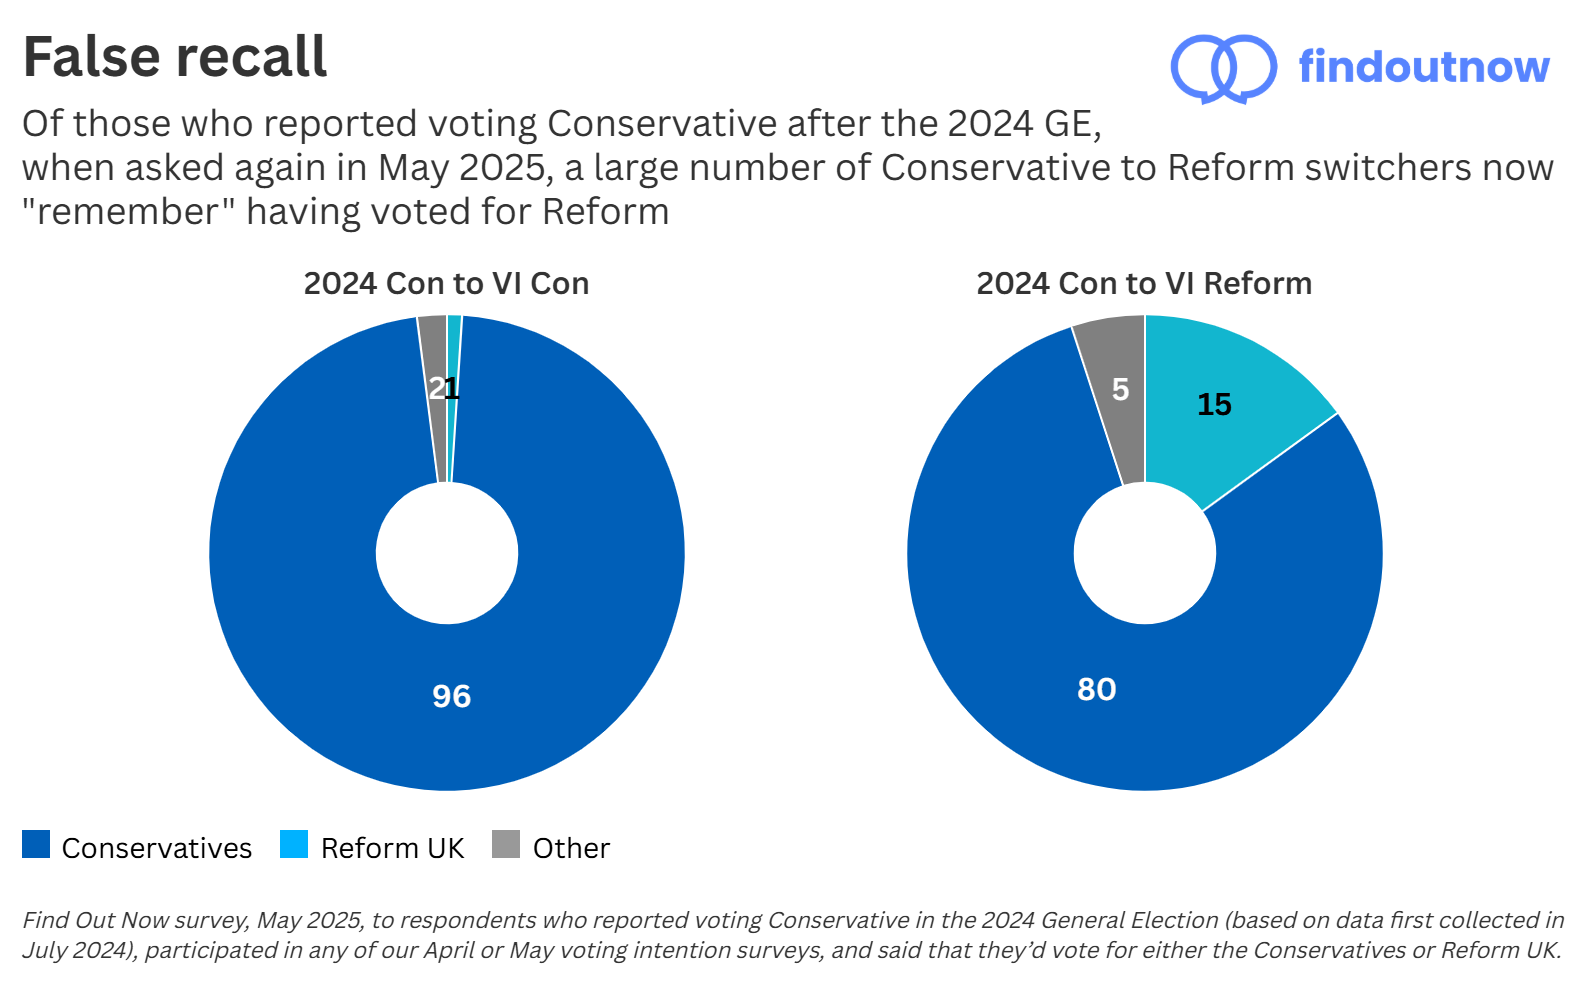
Almost all (96 per cent) of the first group – who voted Conservative before and would again – gave the same answer they reported after the election, that they voted Conservative. However, of the second group – who voted Conservative before but would now vote Reform – there was greater divergence. A significantly higher number now give a different response to what they reported after the election, with 15 per cent saying that they voted for Reform UK. The raw data from the surveys can be found here (Con-Con) and here (Con-Ref).
In addition, it is worth noting that this problem gets worse with time. We ran the same tests 3 months previously, with the effect size being significantly larger in May. While there was no change among Con-Con respondents, Con-Reform switchers went from 10 per cent mistyping themselves as having voted Reform at the last election, to 15 per cent in May. The raw data from those surveys can be found here (Con-Con) and here (Con-Ref).
What does this mean for voting intention polling? Almost all pollsters currently publishing UK voting intentions weight on past vote. I.e. they collect the raw data, and in the same way they do for demographic data like age, gender and region, they would adjust the data to make sure it has the “right” proportions of people based on the results from the last general election. For example, given 40% of people did not vote at the last general election, 40% of their sample should be made up of non-voters. This works well to ensure that the sample is politically representative and genuinely matches the country as a whole. While some degree of false recall is to be expected (people are forgetful!), if a disproportionate number of people who voted for a particular party are not accurately reporting the way that they previously voted, this could significantly bias the final results.
In this case, those who voted Conservative before but now “mistype” as Reform are counting towards the ‘Reform 2024’ quota for the sake of weighting, instead of the ‘Conservative 2024’ quota. This leads to the polling assuming that the Conservatives are keeping much more of their 2024 GE vote share than they actually are, and not assigning the correct proportion of it to Reform – thus suppressing the Reform voteshare overall.
At Find Out Now we have the advantage of running our own panel, with 100,000 respondents doing surveys each day. With our average respondent having been a member of the panel since 2018 and most doing surveys each day, we hold extensive demographic information on every panelist, including their reported past vote. We collect this data immediately after the election and can refer back to it indefinitely – never having to ask it again and avoiding issues with false recall. By contrast, most other polling companies do not run their own panel, and instead have to rely on asking about past voting behaviour at the time of the survey for every respondent in every survey – thus likely experiencing the problems listed above.
Conclusion
In conclusion, we believe that the three factors outlined above – too many highly-engaged respondents, overstated turnout, and false recall of the 2024 General Election vote – are systematically understating Reform’s vote share in current Westminster polling. While Find Out Now has consistently been an outlier on Reform voting intentions, our recent track record and the evidence presented here suggest that this is not a methodological error, but a faithful reflection of current public opinion in the UK